Every image in one space.
Plotlas turns a folder of images — a museum collection, a research corpus, a photo archive — into a single zoomable landscape. Pan across all of it, arrange it by date or category, filter it, then dive into any one picture at full resolution. In the browser, up to a million images.
What it is
A scrollbar is a terrible way to look at fifty thousand pictures.
Large image collections are usually browsed a page at a time — twenty thumbnails, then twenty more. You can see the pictures, but never the collection: which decades are thin, which categories dominate, where the outliers sit, what the whole thing actually looks like.
Plotlas lays the entire collection out at once as a continuous space you can pan and zoom, like a map. Arrange it by date and the shape of the archive appears. Arrange it by category and each group becomes a labelled block you can read at a glance. Zoom into any single image and it resolves to full detail, with its metadata alongside.
The arrangement always comes from your metadata — a date column, a category column, coordinates you supply. Plotlas never inspects the pixels to decide where a picture goes, so the layout means exactly what your data says and nothing else.
How it works
Prepared once, then streamed like a map.
The reason a million images can move smoothly in a browser is that nothing is computed while you look at it. The work happens up front, once.
Images become a tile pyramid
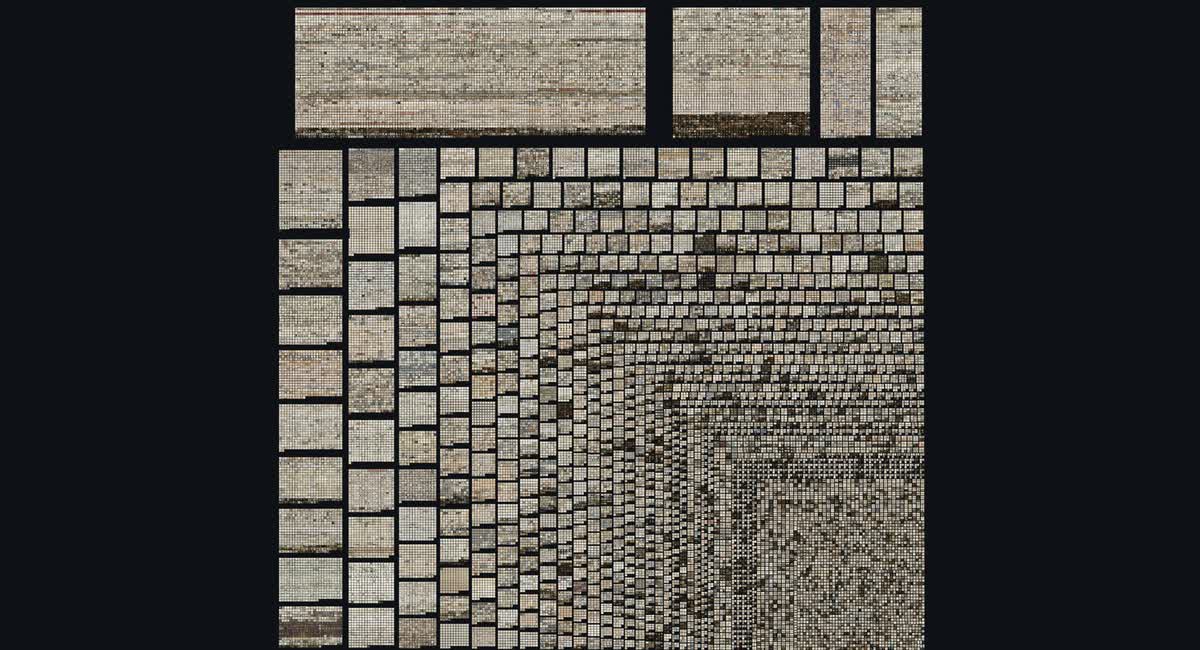
Your folder is processed offline into layers of pre-rendered tiles — a coarse mosaic for the wide view, sharper tiles the further you zoom, full-resolution originals at the bottom. The same idea web maps use.
Only what's on screen travels
A small service streams the handful of tiles your current view needs, plus the metadata for images you click. The collection can be far larger than anything that would fit in memory.
The browser draws it with WebGL
Panning, zooming, filtering and switching between arrangements all happen on the graphics card, locally. No plugin, no desktop install.
Arrangements available today:
Features
What works now, and what comes next.
The demo is a curated, read-only showcase. Bringing your own collection is the next phase — and the thing this site is here to gauge interest in.
- Million-image scale in a browser tab, proven on a real corpus.
- Five arrangements — grid, date, category, scatter, geographic map.
- Any arrangement you can compute — give each image an x and y coordinate and Plotlas lays the collection out that way. Run your images through an embedding model, reduce with UMAP or t-SNE, hand over the result: you get a similarity map, faithful to your coordinates.
- Search — type an artist, title or category and fly straight to it; searching a category snaps to that whole group.
- Category labels and a date axis, so a group or a year is readable without clicking anything.
- Tag filtering — highlight everything matching a tag, dim the rest.
- Click any image for its full metadata, then zoom to full resolution.
- Layout options you choose — axis scale, map projection, overlap handling — each explained, never guessed from your data.
- Self-host with Docker, and ingest your own images plus an optional metadata file today.
- Phones and tablets — the viewer runs in a mobile browser, with touch panning, pinch zoom and a layout built for a small screen.
- Hosted accounts — upload your collection to us and get a link, with no infrastructure to run and resumable transfers for large sets.
- Publish and share — collections are private by default today; what's coming is the control to publish one yourself, and links you can share, revoke, or let expire.
- Subset layouts — arrange a filtered slice of a collection, so one dataset can carry both a curated highlights view and the full set.
- Computed layouts — we run the embedding model and the dimension reduction for you, so a collection with no useful metadata still gets a similarity map without you building a pipeline first. (You can already do this yourself and hand us the coordinates — see the live column.)
- Richer filtering and larger corpora.
No dates attached — this is the direction, not a schedule. If something here matters to your work, say so and it moves up.
Two ways to run it
Run it yourself, or let us run it.
Self-host
Plotlas is source-available and free for noncommercial use. It runs on one machine with Docker, stores everything on your own disk, and makes no outbound calls — which matters if your collection can't leave the building.
cd plotlas
docker compose up --build
Then open localhost:8080. Your collections live in a plain ./data folder — back it up with tar, or move the installation by moving the folder.
Commercial use needs a separate licence — licensing@plotlas.com.
Ask us to host it
If you'd rather not run infrastructure, we'll bake and host your collection for you and give you a link to share. We're taking on collections now, and we're genuinely interested in what people are trying to look at — feedback shapes what gets built next.
Tell us what you have: hello@plotlas.com
Acknowledgement
Standing on PixPlot's shoulders.
Plotlas owes its starting point to PixPlot, the Yale DH Lab's image-collection viewer. If you know PixPlot, you'll recognise the idea immediately; Plotlas takes it toward much larger collections, metadata-driven arrangements, and a hosted option.
Citation details live in CITATION.cff in the repository.